How to use Stock Trender
Reading the charts
Using easy to read graphs, you'll be able to quickly spot stock trends:
- It uses a time-tested formula to spot the best time to buy or sell a stock, or to get in or out of the market in general.
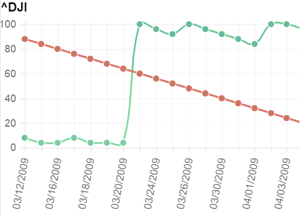
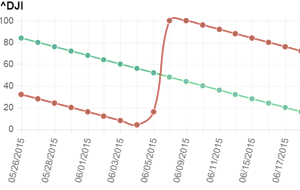
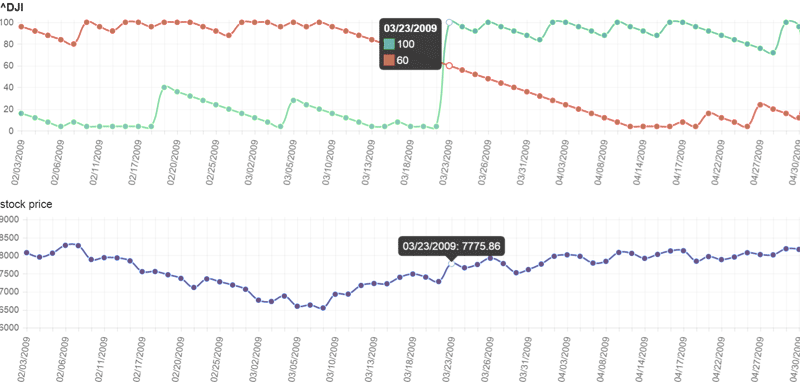
- The green line shows how likely the stock is to keep rising. The red line shows how likely it is to keep falling.
- The key is to buy when the green line jumps to 100 and crosses the red line, or sell when the red line jumps to 100 and crosses the green line.
- The period is how many days the formula looks back. Shorter periods react faster; longer ones signal less often.
Example
When the green line goes to 100 and crosses the red line, that's the signal to BUY (usually within 48 hours):
When the red line goes to 100 and crosses the green line, that's the signal to SELL (usually within 48 hours):
In other words, when it shows it's time to buy (or sell), the chances are higher that the stock keeps going up (or down).
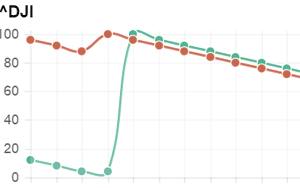
If the green line crosses but there's no gap between the two lines, that does not mean BUY:
History doesn't prove the future. But if you had been using this chart and listened to it, you would have sold before the market crash of 2008:
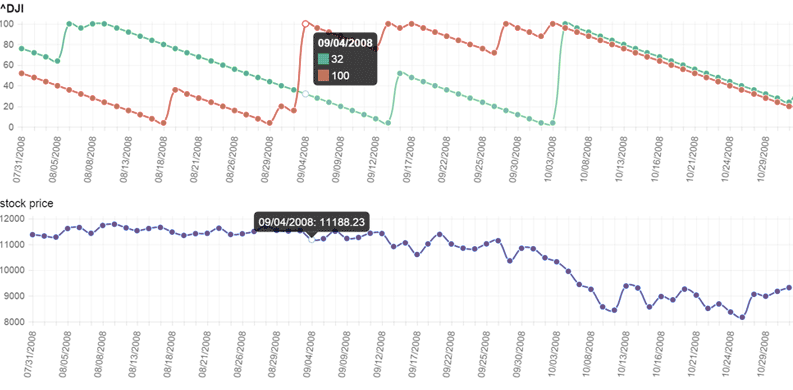
And you would have known when to get back in as the market recovered in 2009:
Favorites and alerts
- After generating a chart, click Add Favorite to save the symbol with its range and period. My Favorites shows all their charts at once.
- Every trading day, if one of your favorites has a BUY or SELL signal, you get a message in your Messages (the red number in the top bar shows how many are unread). To get your messages by email too, turn that on at the top of the Messages page.
- Open a message to mark it read, or tick several and mark them read or delete them.
Auto Trader
The Auto Trader follows the signals on your favorites for you, every trading day, in your own Robinhood account. It's an extra subscription: $1.99 a month or $19.99 a year, billed by PayPal until you cancel.
What it does
- SELL signal: sells a percentage of the shares the Auto Trader bought (half by default), or a dollar amount's worth of them. It never sells more than it holds, and shares you bought yourself are never sold.
- BUY signal: buys the dollar amount you choose, or a percentage of the value of the shares the Auto Trader already holds.
- Recurring buys (optional): buys your favorites every trading day, or on the first trading day of each week, month or quarter. The amount is split evenly, or by the percentage you give each favorite.
- It trades up to 20 of your favorites (the ones you saved first). Each one uses its own chart period.
- It never spends more than the per-order and daily limits you set. Orders over a limit are held, not placed, and you get a message.
- Orders go in after the market opens; you get a message with what was placed and, later, what filled.
Setting it up
- Save your favorites on the chart page.
- Subscribe from the Auto Trader link in the top bar.
- Start with a paper account (no real money): add an account in Paper mode and watch the trades it would make.
-
To trade for real, connect Robinhood:
- In the Robinhood app, turn on agentic trading for the account the Auto Trader should use.
- On the Auto Trader page, open Manage connection and click Log in to Robinhood. Log in and click Allow.
- The tab then lands on a page that "can't be reached". That's expected: copy its whole address, paste it back on the connection page and click Finish connecting.
- The connection page lists your Robinhood accounts. Copy the number of the one marked agentic.
- Add a Live account with that account number, your amounts and your limits. You can have one live account.
Managing it
- Change settings on an account at any time; they apply from the next trading day.
- Pause an account to stop new trades (open orders still settle), and Resume it later.
- Delete an account to stop tracking it. Nothing is sold; your shares stay in Robinhood.
- Cancel the subscription on the subscription page. The Auto Trader keeps running until the end of the period you paid for, then your accounts are paused (nothing is sold). Subscribe again to restart them.
Please note: there are no guarantees in the market. Signals predict what's most likely to happen, not what will, and the Auto Trader can lose money. Use Stock Trender as a tool to supplement your own informed decisions.